Outdated or Unsupported Browser Detected
DWD's website uses the latest technology. This makes our site faster and easier to use across all devices. Unfortunatley, your browser is out of date and is not supported. An update is not required, but it is strongly recommended to improve your browsing experience. To update Internet Explorer to Microsoft Edge visit their website.
August 2, 2021

The state and nation are experiencing a major demographic shift as the overall population ages and baby boomers retire. Coupled with the trailing effects of the Covid-19 pandemic on the labor force, we are experiencing an unprecedented period of tight labor market conditions. With competition for talent heating up, the Wisconsin Department of Workforce Development (DWD) economists are often asked about competitive wages for various occupations in an area.
The wage data comes from the Occupational Employment and Wage Statistics (OEWS) survey, a joint effort of the U.S. Department of Labor (DOL), Bureau of Statistics (BLS), and the Wisconsin DWD. The survey's purpose is to identify which occupations are in demand, estimate the number of employees in each, and determine the wages paid to them. More information and tools to access the data can be found on DWD's labor market information website.
There are multiple tabs with useful visualizations and maps of the data – for this purpose, I prefer the Simple Employment Search shown below.
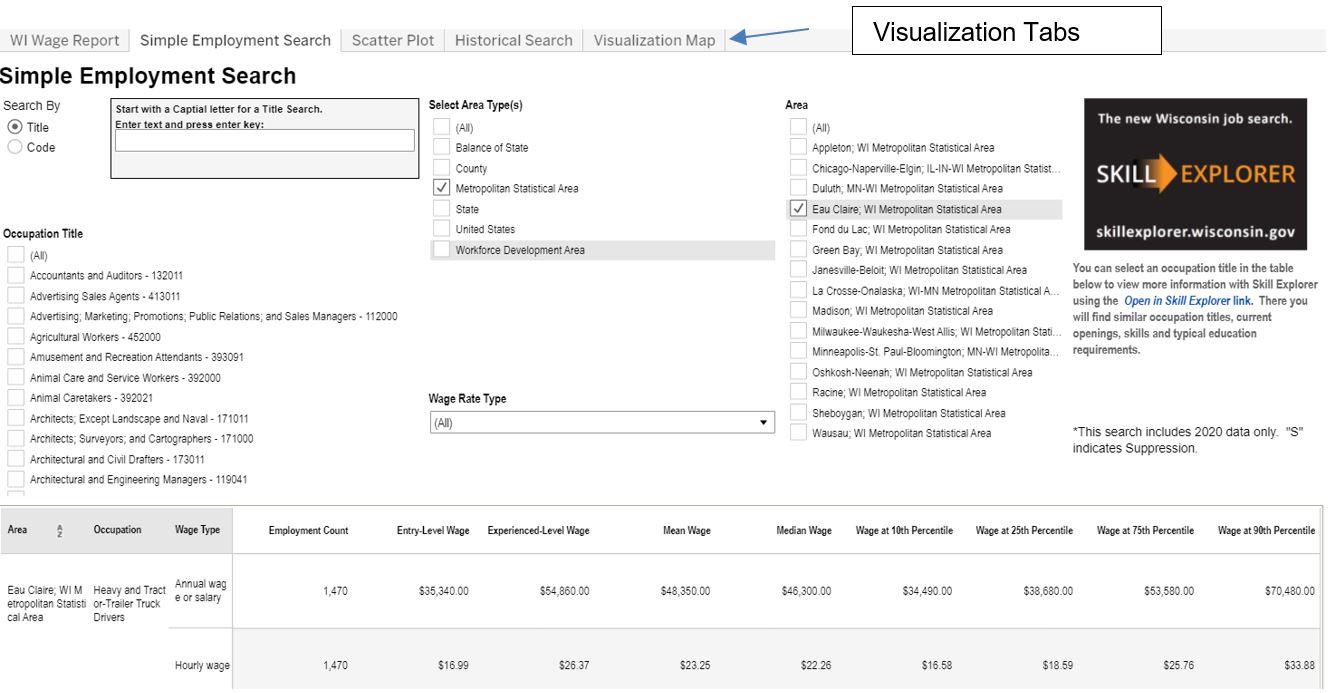
The first step is to enter part or all of an occupation title in the search box (or choose one from the list). It's important to remember that while occupations can have many different working titles, the federal Standard Occupation Code (SOC) titles are those listed in this tool. If you're having difficulty figuring out what the occupations you're trying to find are titled, the search tool on this US DOL site can help narrow down the possible choices.
Next, choose one or more geographies using the Area Type(s) and Area check box menus, as shown where the Eau Claire Metropolitan Statistical Area (MSA) was chosen in the example. It's important to note this survey was designed to collect wage data at the state and MSA level. So, while it is possible to choose other geographies, they could be less accurate than the level for which it was designed.
The data will populate below in a table with a variety of indicators, including a sample entry-level wage and experienced level wage. The median is our preferred indicator of the standard wage for the occupation in the area, as it is the mathematical middle of the distribution - the point at which 50% of those in the occupation make more and 50% make less.
Checking your wage levels is a great way to stay competitive in today's labor market. With WisConomy, the wage data is at your fingertips, along with a wealth of other labor market information. Please don't hesitate to contact our DWD economists with any questions!
DWD Contact Information
201 E. Washington Ave
P.O. Box 7946
Madison, WI 53707
(608) 266-3131
Sign up for DWD news and updates
A proud partner of the ![]() network
network